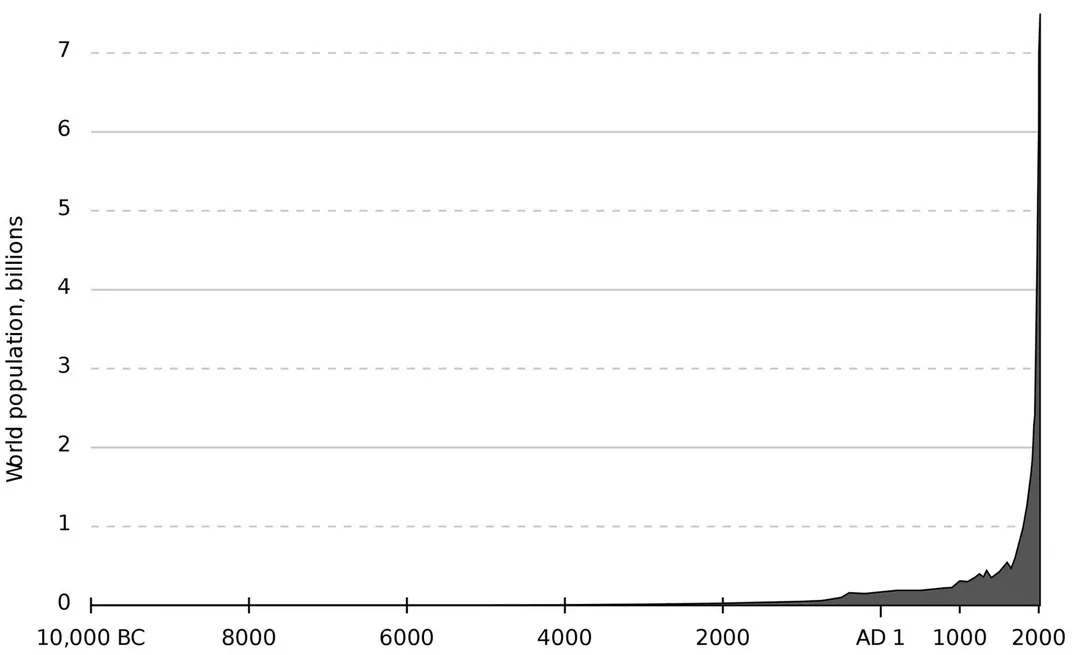
Kavin decided to read my copy of Factfullness (https://www.goodreads.com/book/show/34890015-factfulness). Page 80 has the graph "world population from 8000 BC till today". It is an exponential growth graph. He was amazed. So we decided to simulate exponential growth on paper. He was shocked to see how it easy it is for things to get out of hand. 1 pair of rabbits can lead to 4 million rabbits in a period of 4 years!
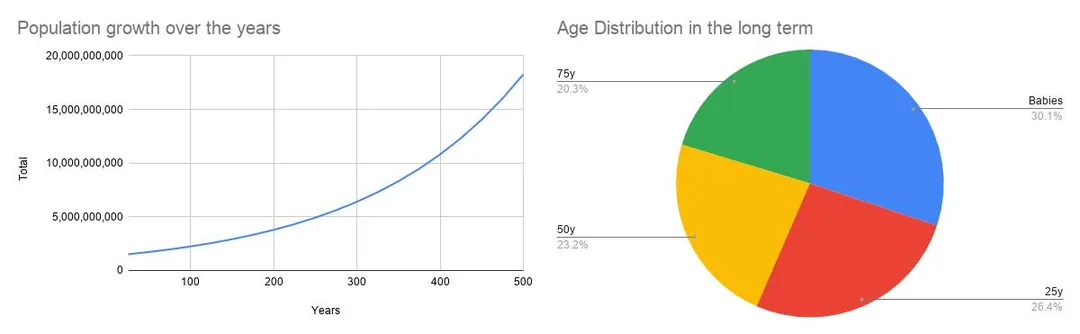
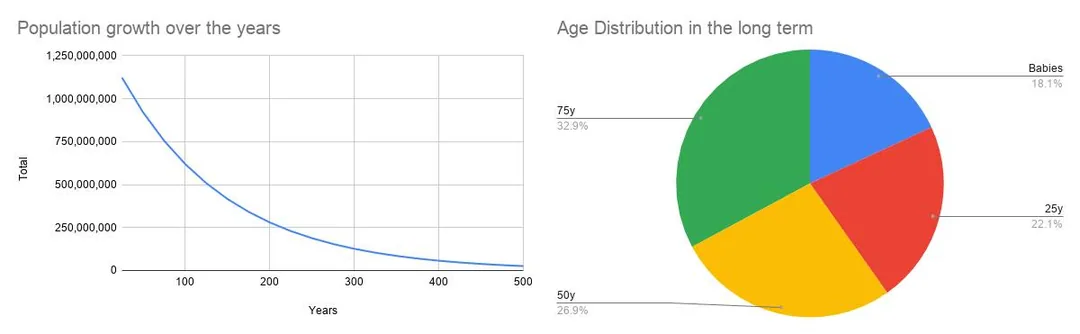
We then made a naive representation of exponential growth in a spreadsheet: https://docs.google.com/spreadsheets/d/1PkmsuFe4Cv9OU8idSJ87GEksxAqJRfgEXz08epy9ovk/. Gapminder says (https://www.gapminder.org/tools/#$state$marker$axis_y$which=children_per_woman_total_fertility&domainMin:null&domainMax:null&zoomedMin:null&zoomedMax:null&spaceRef:null;;;&chart-type=bubbles) 2018 fertility rates per woman were 2.28 for India, 1.64 for China. At this rate, an assumed life expectancy of 75 years (https://www.gapminder.org/tools/#$chart-type=bubbles), and an average reproductive age of 25 years, we came up with some startling graphs for India and China.
Attached are pics of our crude approximation for the future of India and China, with current population and fertility+mortality rates. Maths (with kids) is fun.
(Singapore has life expectancy of 84 years, per capita income of $84K/year, fertility rate of 1.26. Outlier!)
Thanks to Meera Kri for recommending Factfullness, and Ron Lancaster for conducting a Maths Walk at the kids' school.
Edit: Just a few weeks ago Kavin and I were looking at exponential population growth, as documented above. And now this: https://youtu.be/Kas0tIxDvrg - we are having to study exponential growth to understand the spread of COVID-19. Turns out it is never too early to study maths. And no amount of exposure to maths is useless. Too often maths is simply a tool to study already occurring natural phenomena. Equipped with the right mathematical tools, children can make the right data driven decisions in crisis situations.
We then made a naive representation of exponential growth in a spreadsheet: https://docs.google.com/spreadsheets/d/1PkmsuFe4Cv9OU8idSJ87GEksxAqJRfgEXz08epy9ovk/. Gapminder says (https://www.gapminder.org/tools/#$state$marker$axis_y$which=children_per_woman_total_fertility&domainMin:null&domainMax:null&zoomedMin:null&zoomedMax:null&spaceRef:null;;;&chart-type=bubbles) 2018 fertility rates per woman were 2.28 for India, 1.64 for China. At this rate, an assumed life expectancy of 75 years (https://www.gapminder.org/tools/#$chart-type=bubbles), and an average reproductive age of 25 years, we came up with some startling graphs for India and China.
Attached are pics of our crude approximation for the future of India and China, with current population and fertility+mortality rates. Maths (with kids) is fun.
(Singapore has life expectancy of 84 years, per capita income of $84K/year, fertility rate of 1.26. Outlier!)
Thanks to Meera Kri for recommending Factfullness, and Ron Lancaster for conducting a Maths Walk at the kids' school.
Edit: Just a few weeks ago Kavin and I were looking at exponential population growth, as documented above. And now this: https://youtu.be/Kas0tIxDvrg - we are having to study exponential growth to understand the spread of COVID-19. Turns out it is never too early to study maths. And no amount of exposure to maths is useless. Too often maths is simply a tool to study already occurring natural phenomena. Equipped with the right mathematical tools, children can make the right data driven decisions in crisis situations.